Analysis#
In some cases, you might get an issue from the users/business owners of your model which has not shown up in any of the alerts. That might happen due to an issue in a specific segment that was not major enough to impact the whole dataset, but creates issues in a specific region or is associated with bias.
In order to maximize the capabilities of this tool it is recommended to follow these steps:
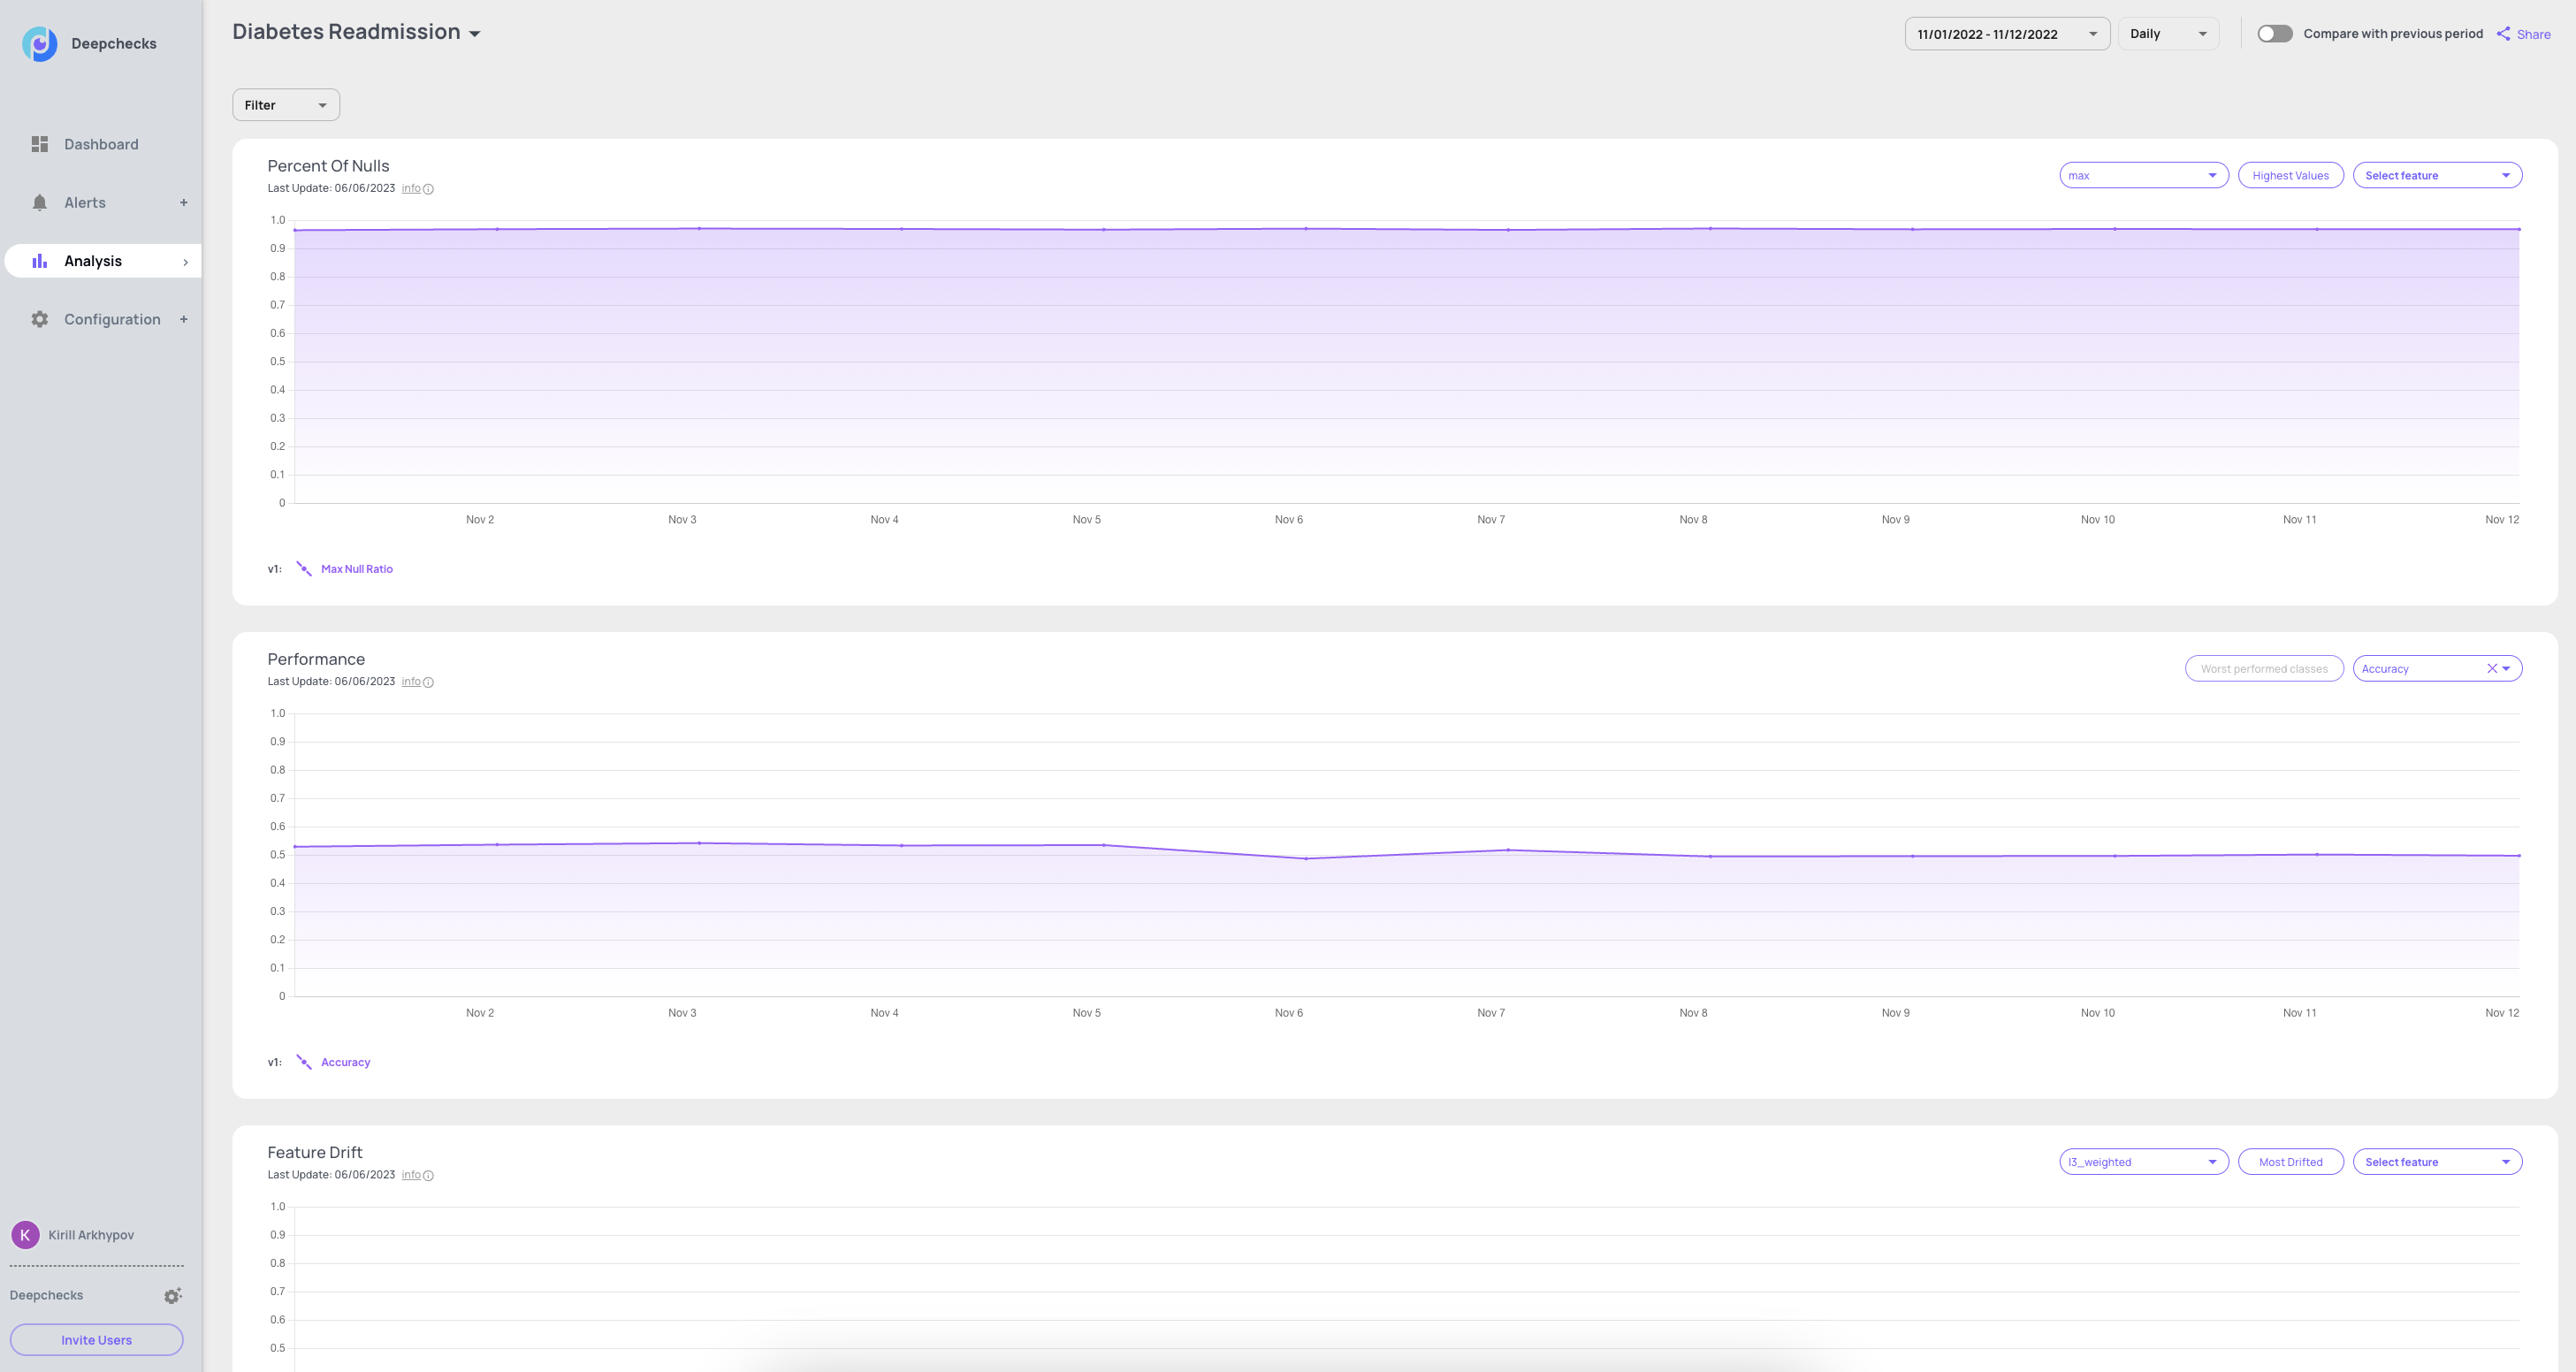
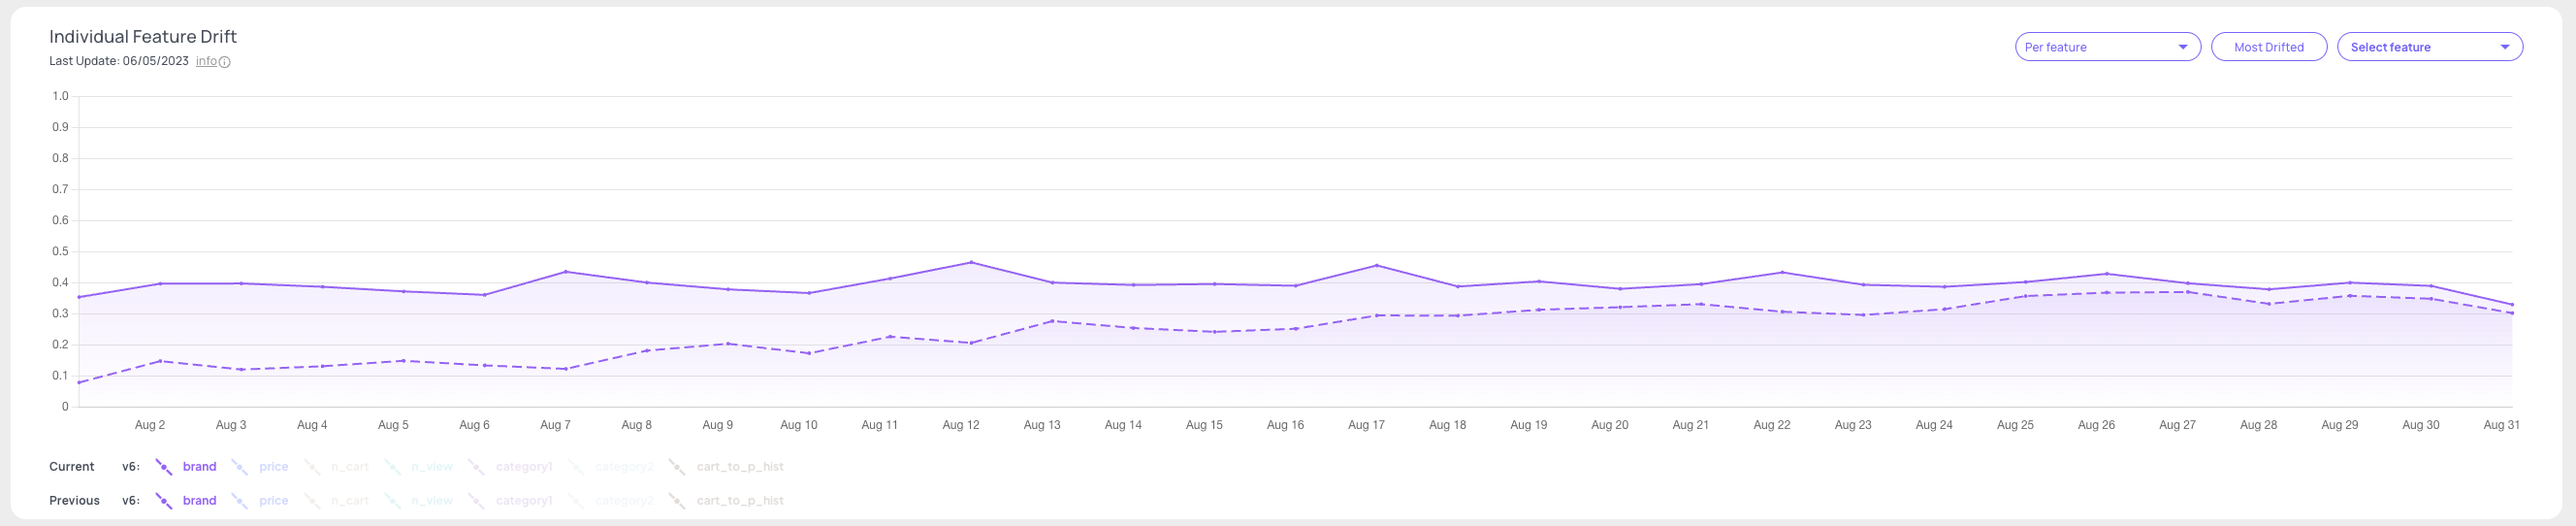
Focus on a specific check which seems to have a significant change.
Optional - you can narrow down the data segment on which all the checks run, by choosing a feature and applying the desired filter, using the filters selection at the top.
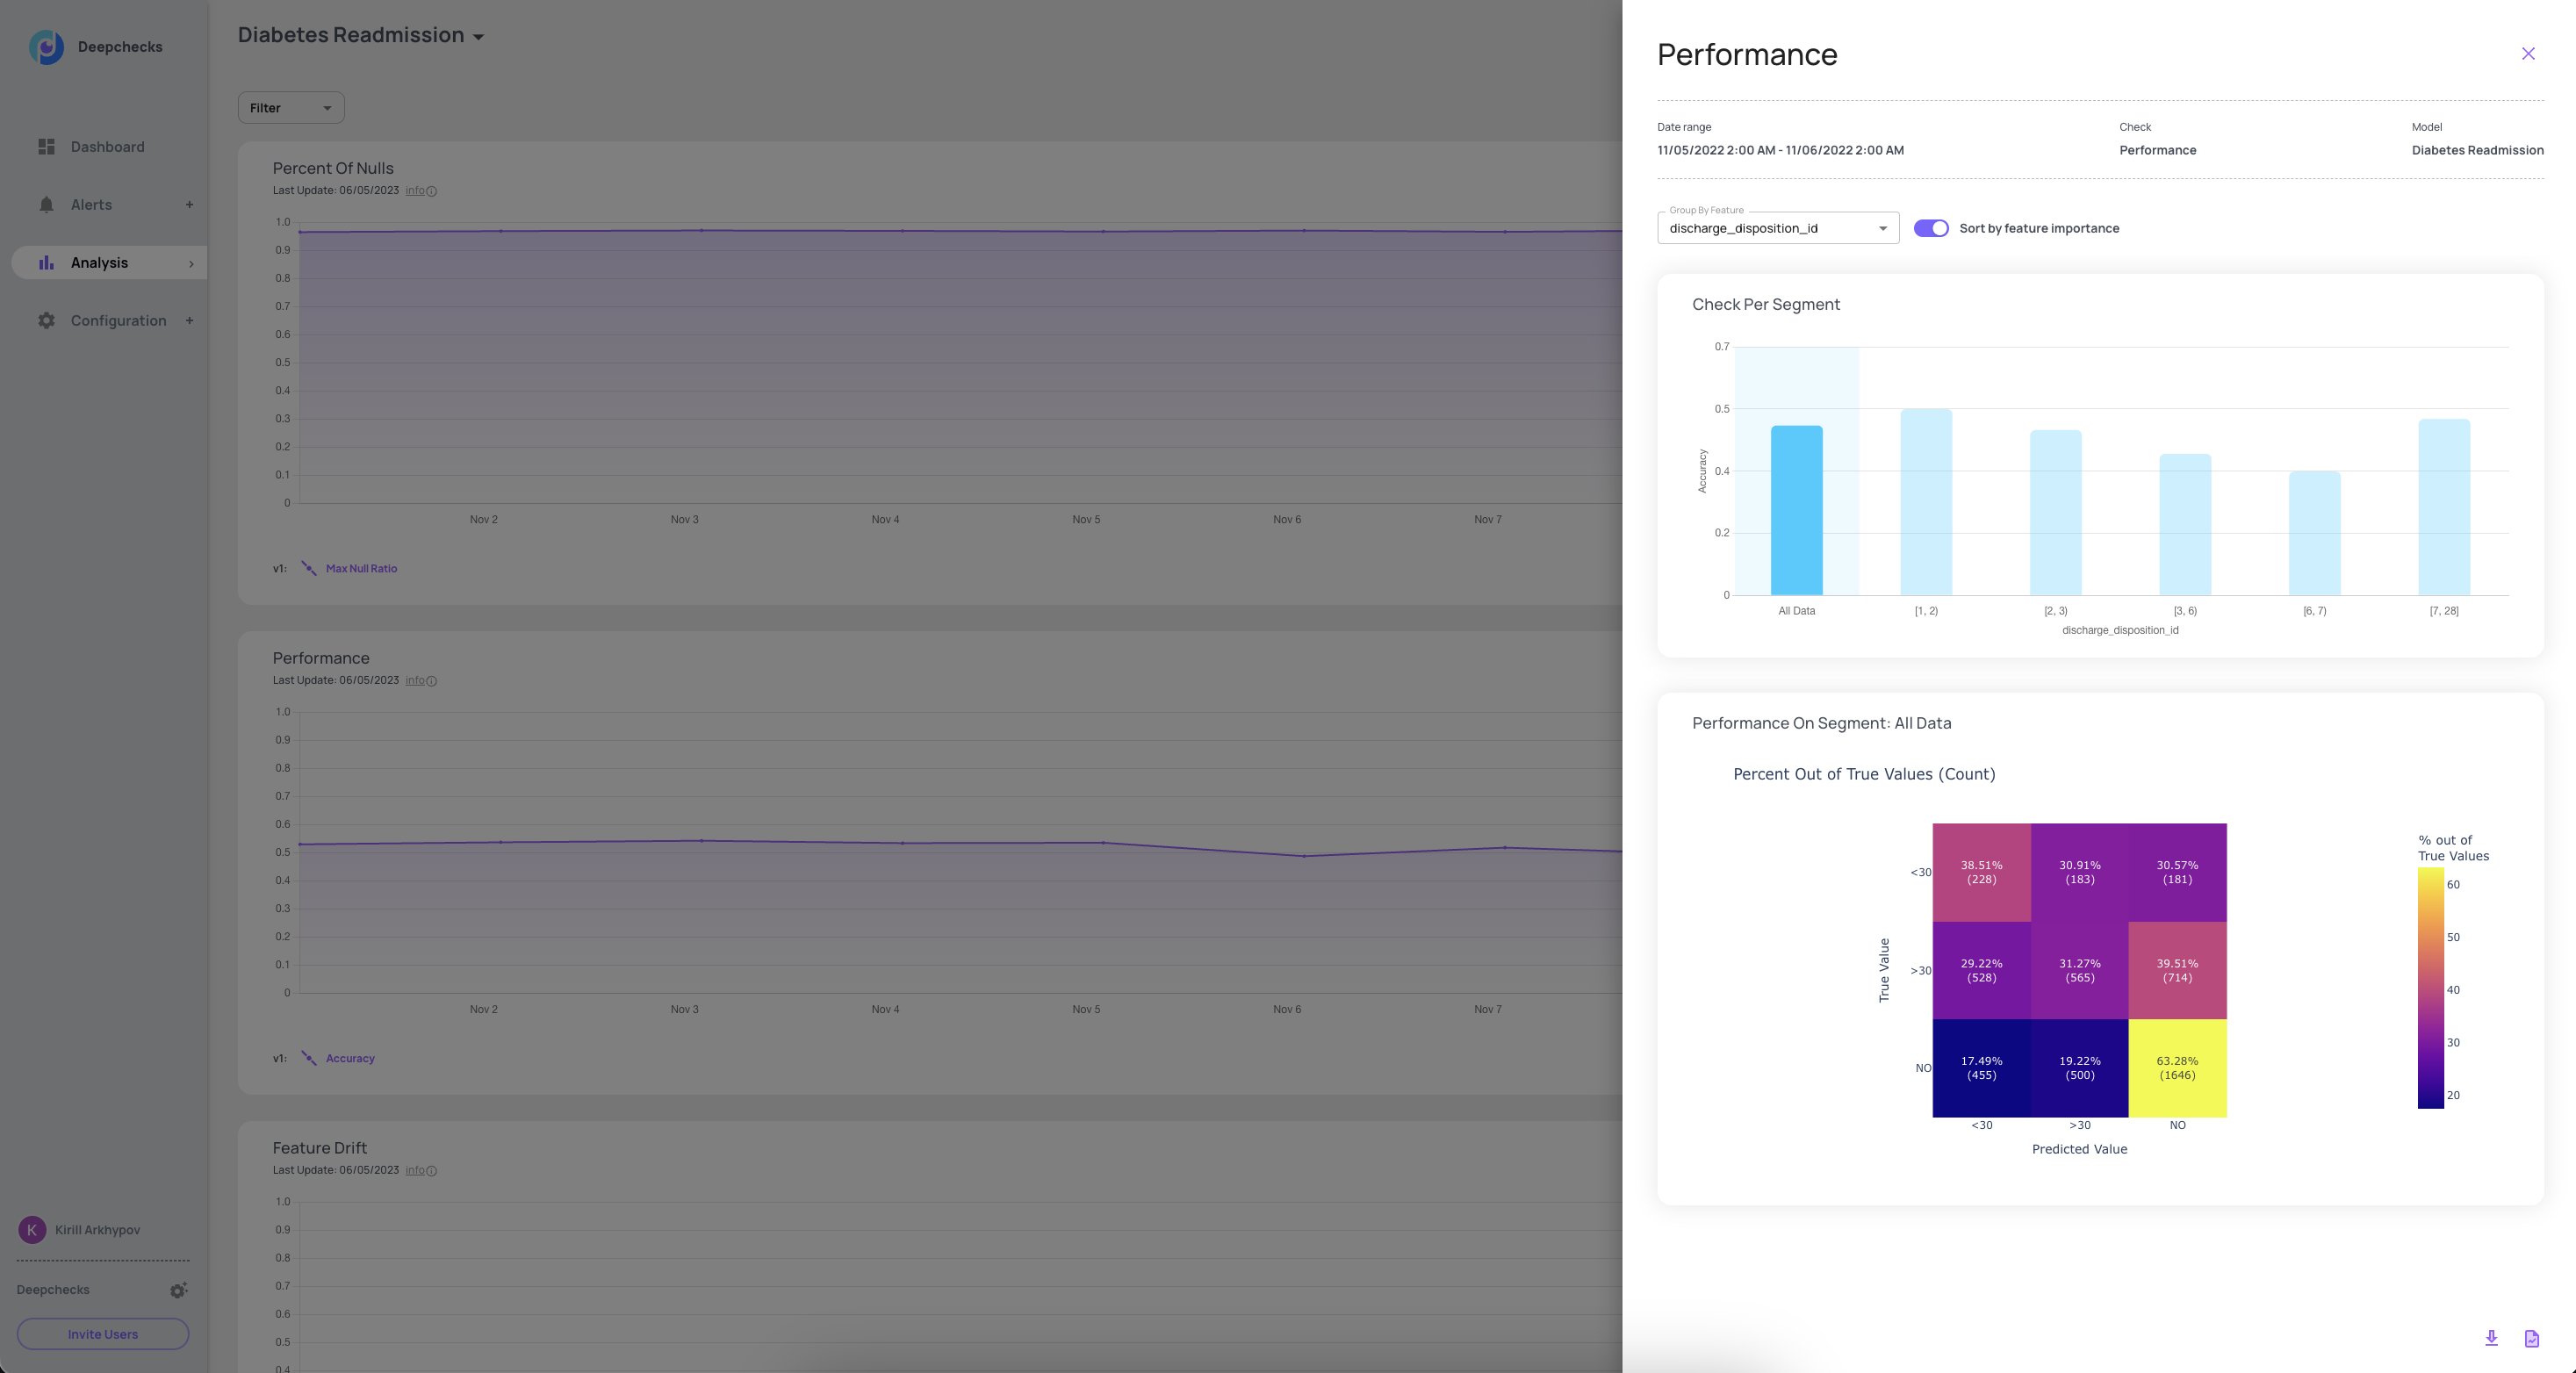
Clicking on a specific point in a Check’s graph will open the drilldown view, which enables you to further slice the check’s results on the data in that timeframe, by focusing on sub-segments of an additional selected feature (features can be selected in the dropdown and are sorted by importance).
At that point, you will be able to launch the full test suite or to get the segmented data directly to your favorite Python environment (Using the “Download” button below).
Data Comparison#
Comparing current results to those on a previous period (e.g. performance during current week vs. previous week) is useful when trying to figure out what went wrong and when did things start deteriorating. When data comparison mode is on, both graphs will be shown for each of the checks and you can turn each of the graphs on/off by clicking on their respective legends.
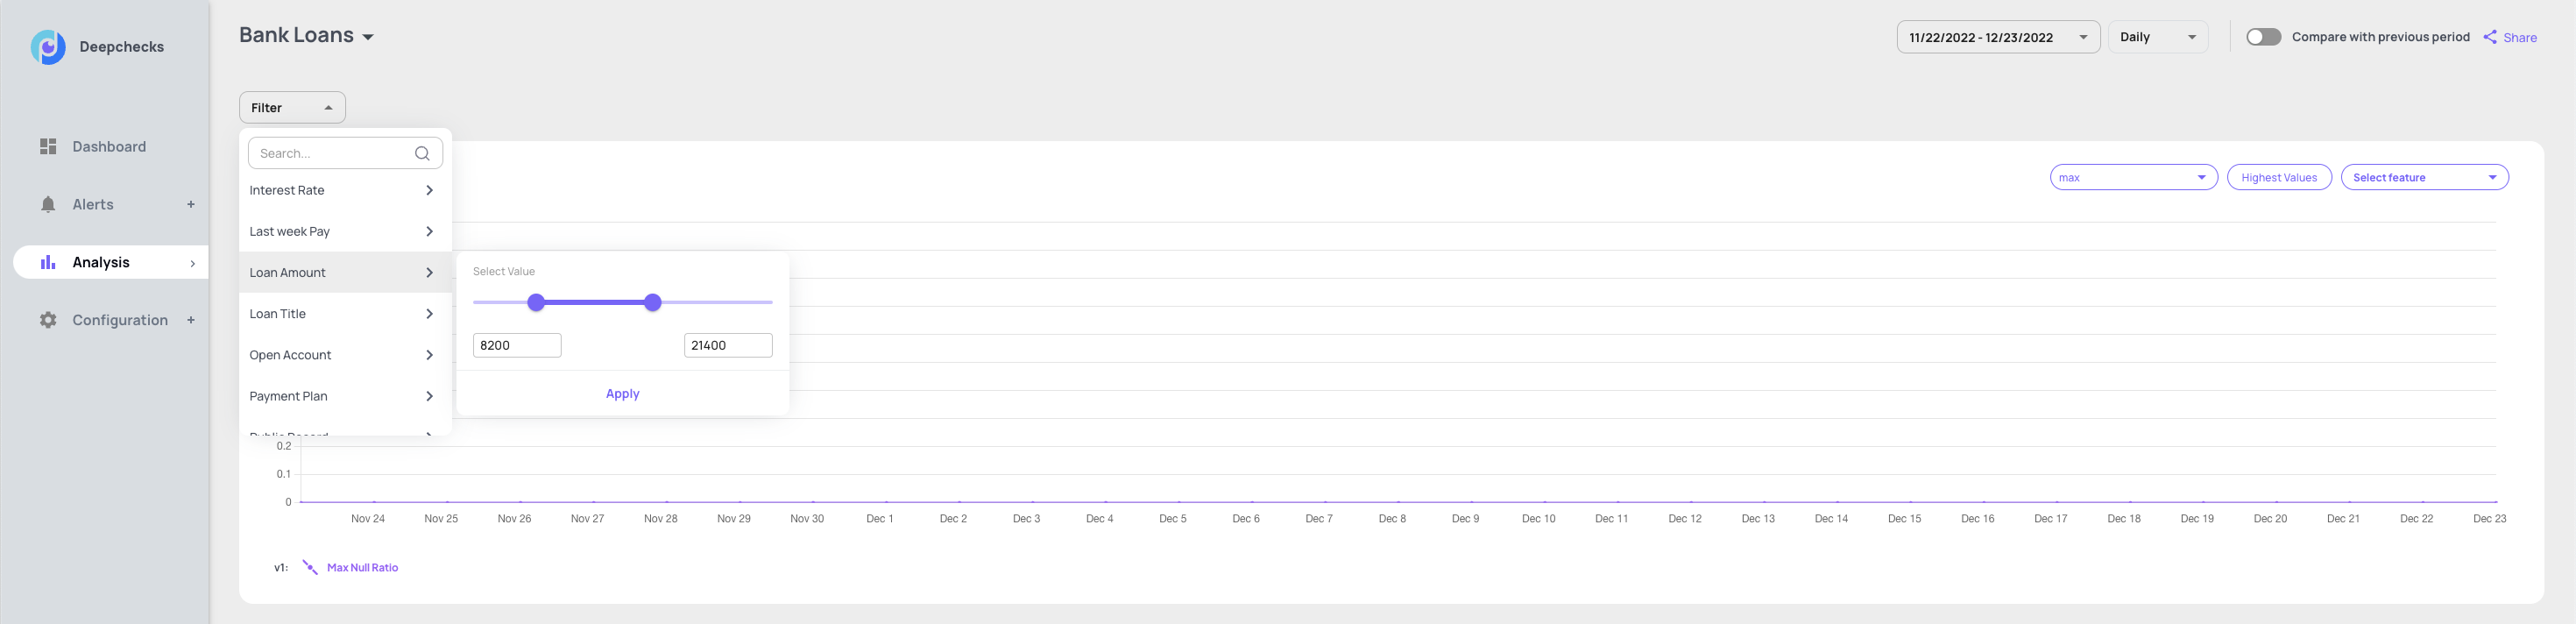
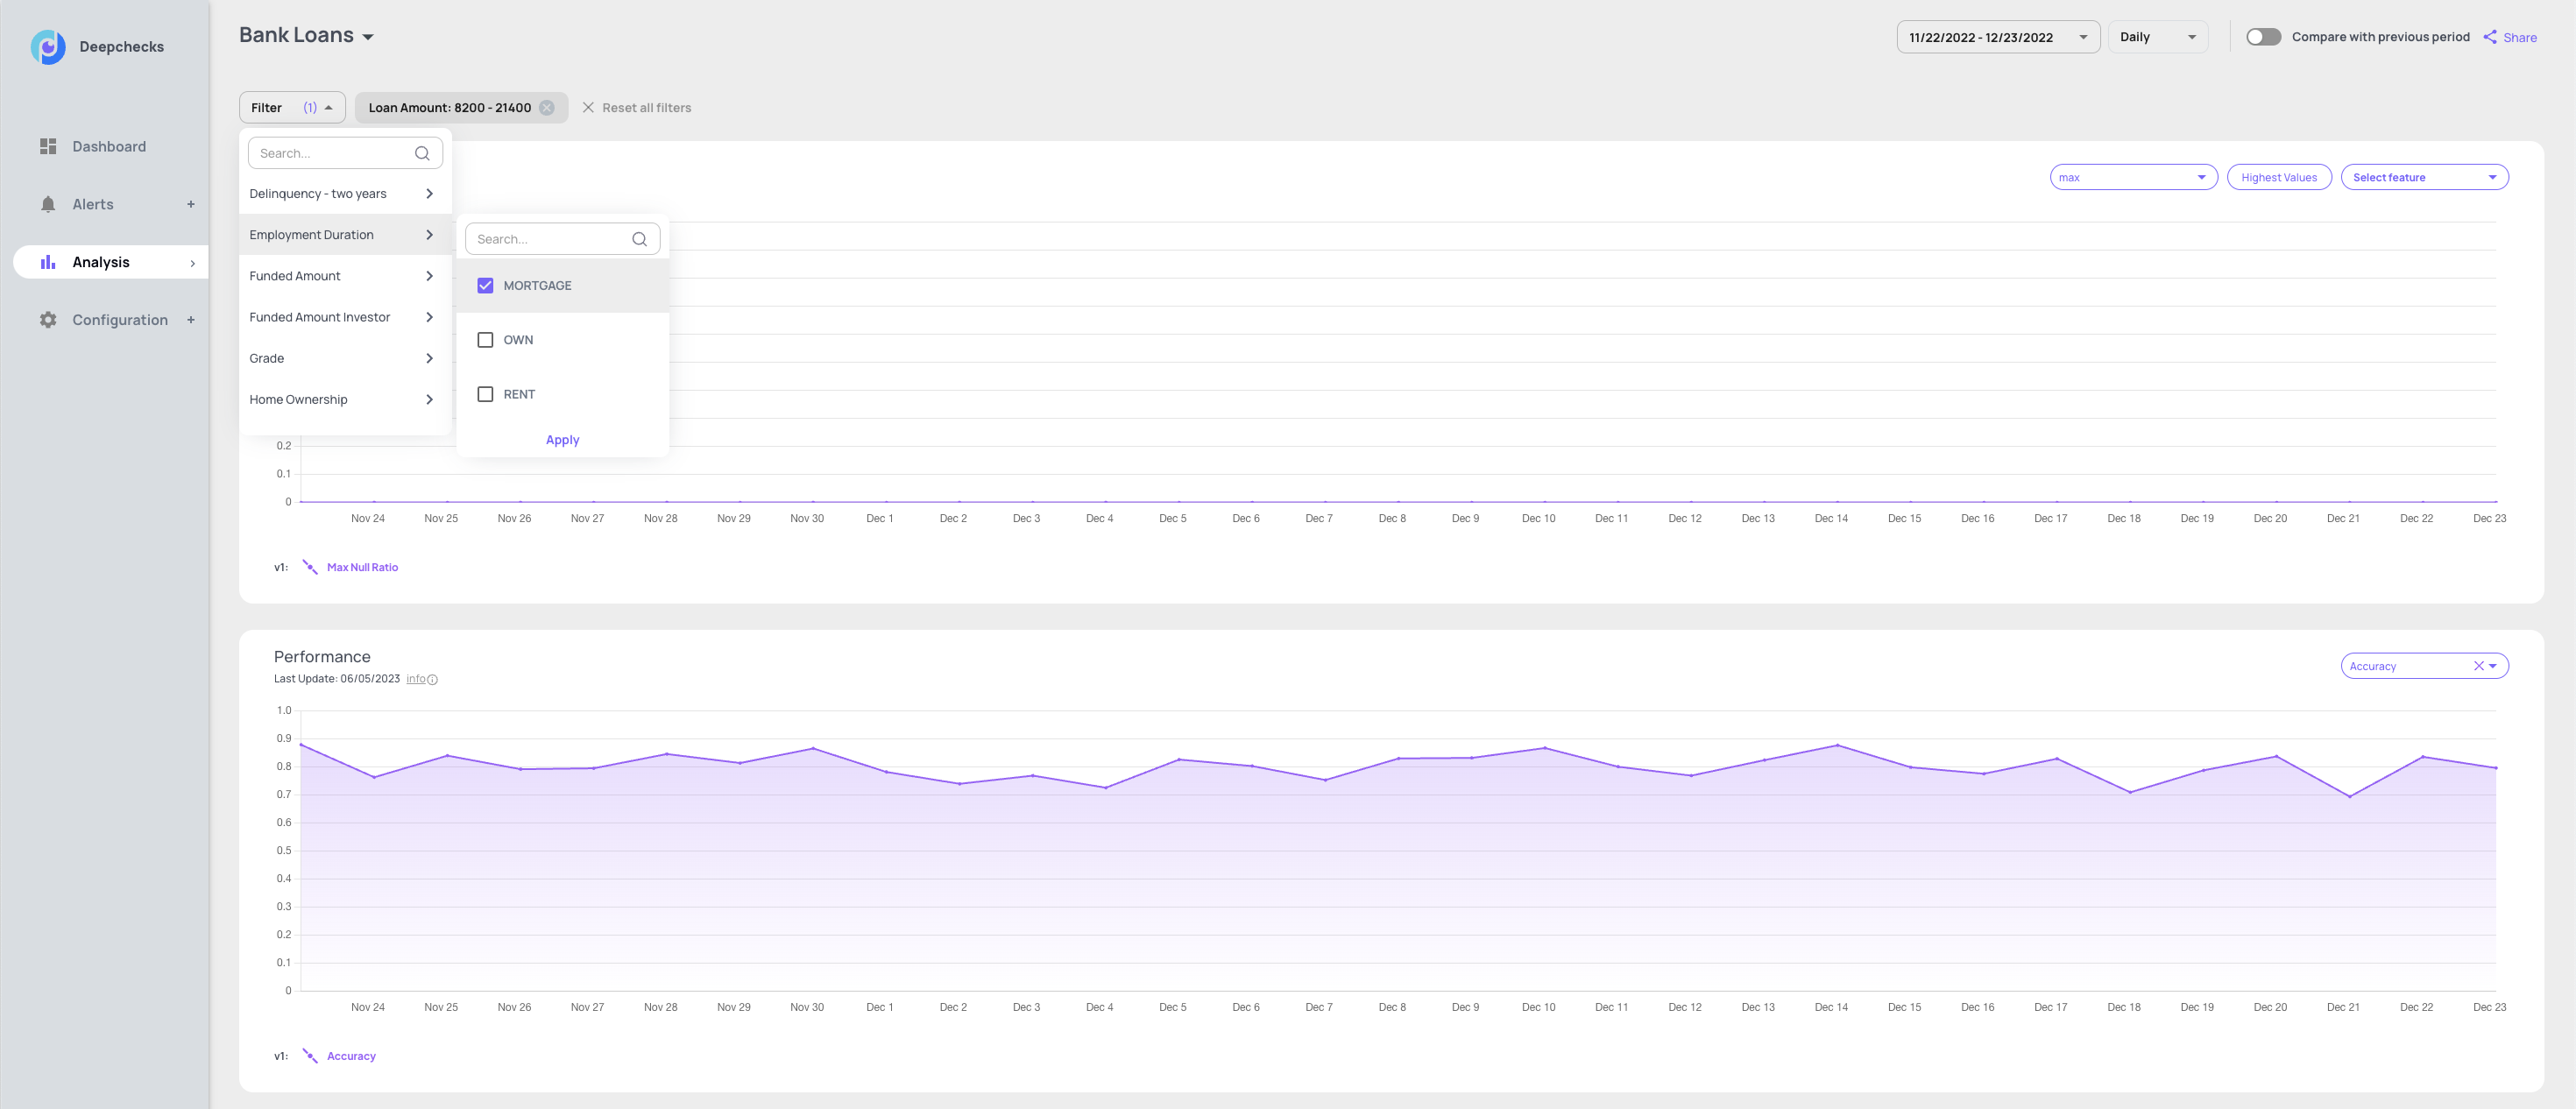
Filters#
Select features and value/range of values to slice the data and see all check results on the selected segments in cases where you have a hint on where the problem might be (example: a certain brand that is not selling well in some regions for an e-commerce site pricing model). Filters can also be applied on “additional data” (per-sample metadata that the wasn’t given to the model as a feature, e.g. country code may be additional data if not used for training the model), if supplied.
Drilldown#
Once you have selected a graph point, the drill-down shows the check results, segmented by the values of the most important feature. The feature drop down is sorted by the descending order of feature importance. The default segment is “All data” and it shows the results of the alert’s check for that segment. You can choose a different segment or change the check as part of the analysis process.