Dashboard#
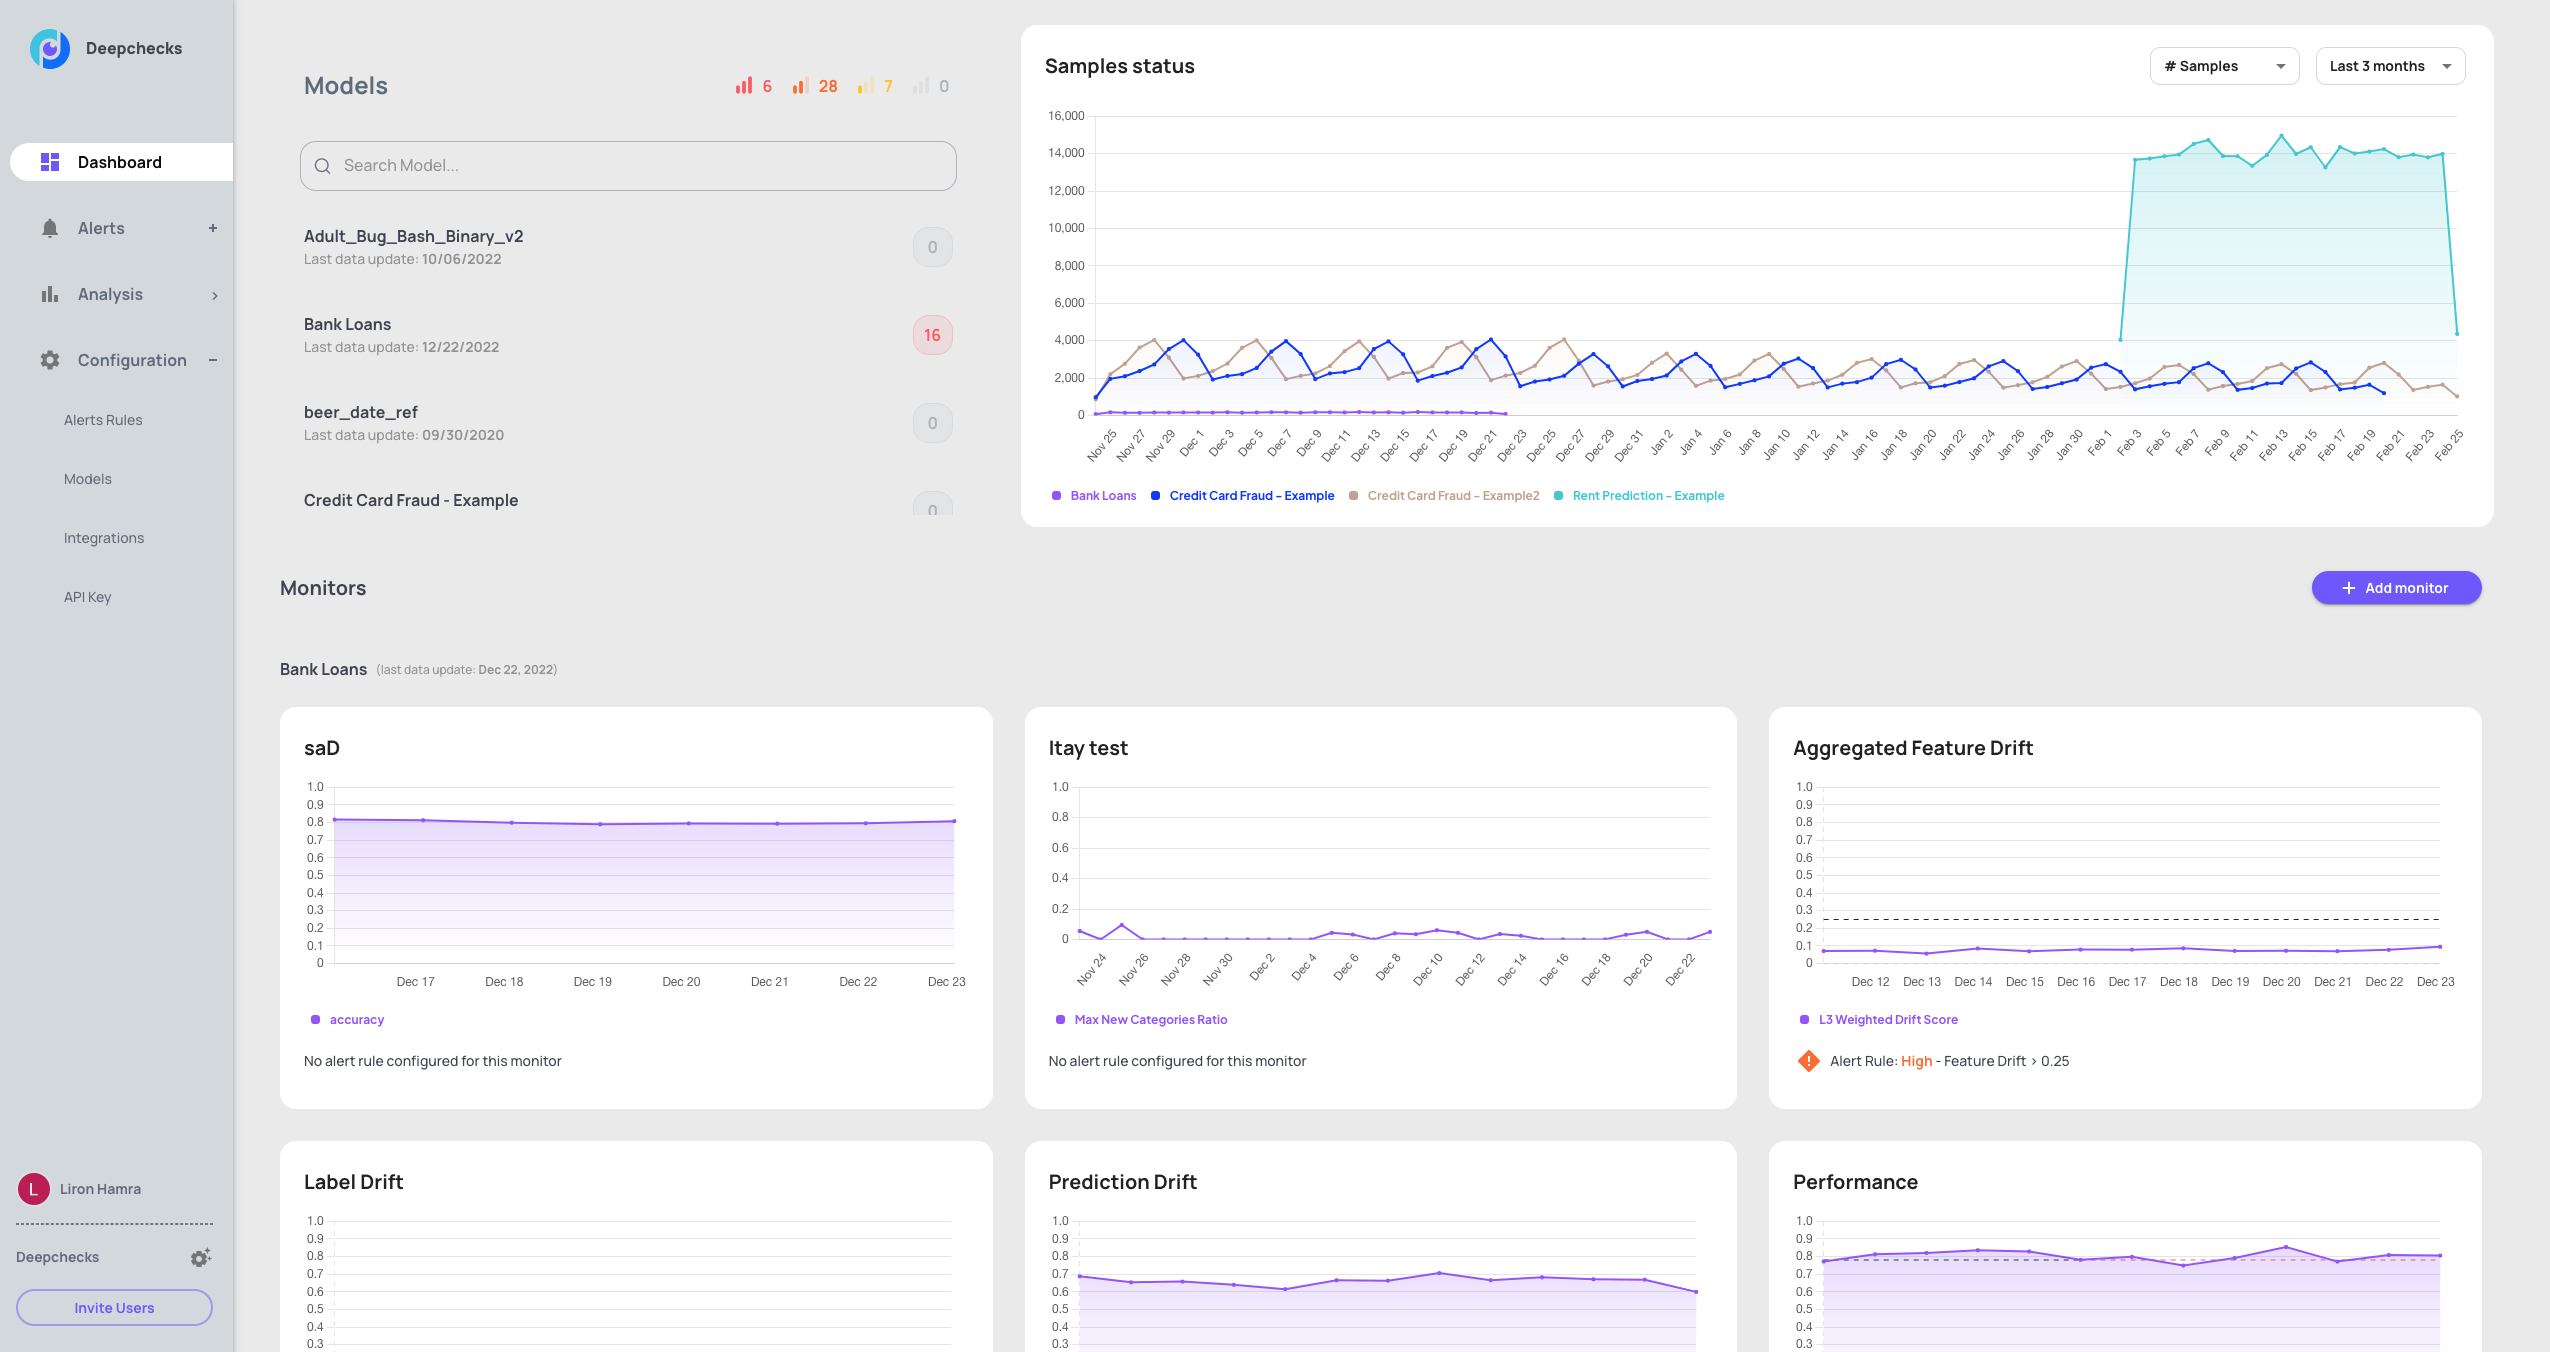
When one needs to get a quick status of their ML models, the dashboard provides a high level overview. At a glance, you can see the number of unresolved alerts, the number of predictions per day. A more expanded view of the dashboard details all the monitors, organized by model.
The key interactive areas here are:
Hovering on a graph will give you contextual information on the monitor’s value for that graph on the viewed date.
Clicking on the digit representing the number of alerts (both in the header and in the model list) will take you to the alerts view.
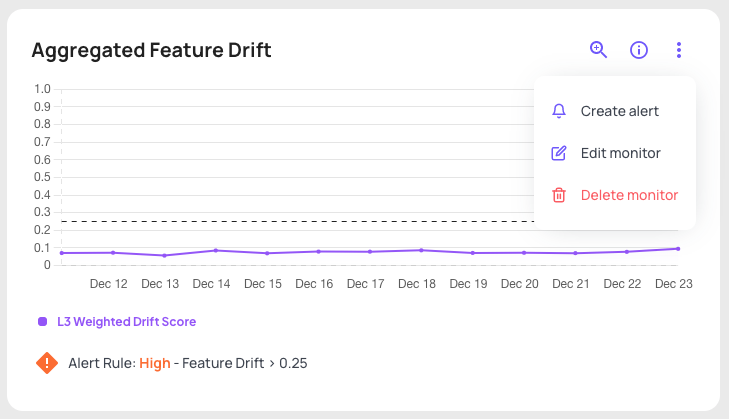
Hovering over a monitor’s graph will reveal an information icon and a submenu for configuring the monitor and/or alert on it. The information icon will lead you to the check’s documentation.
The default view of the dashboard shows the defined monitors on all of the models.
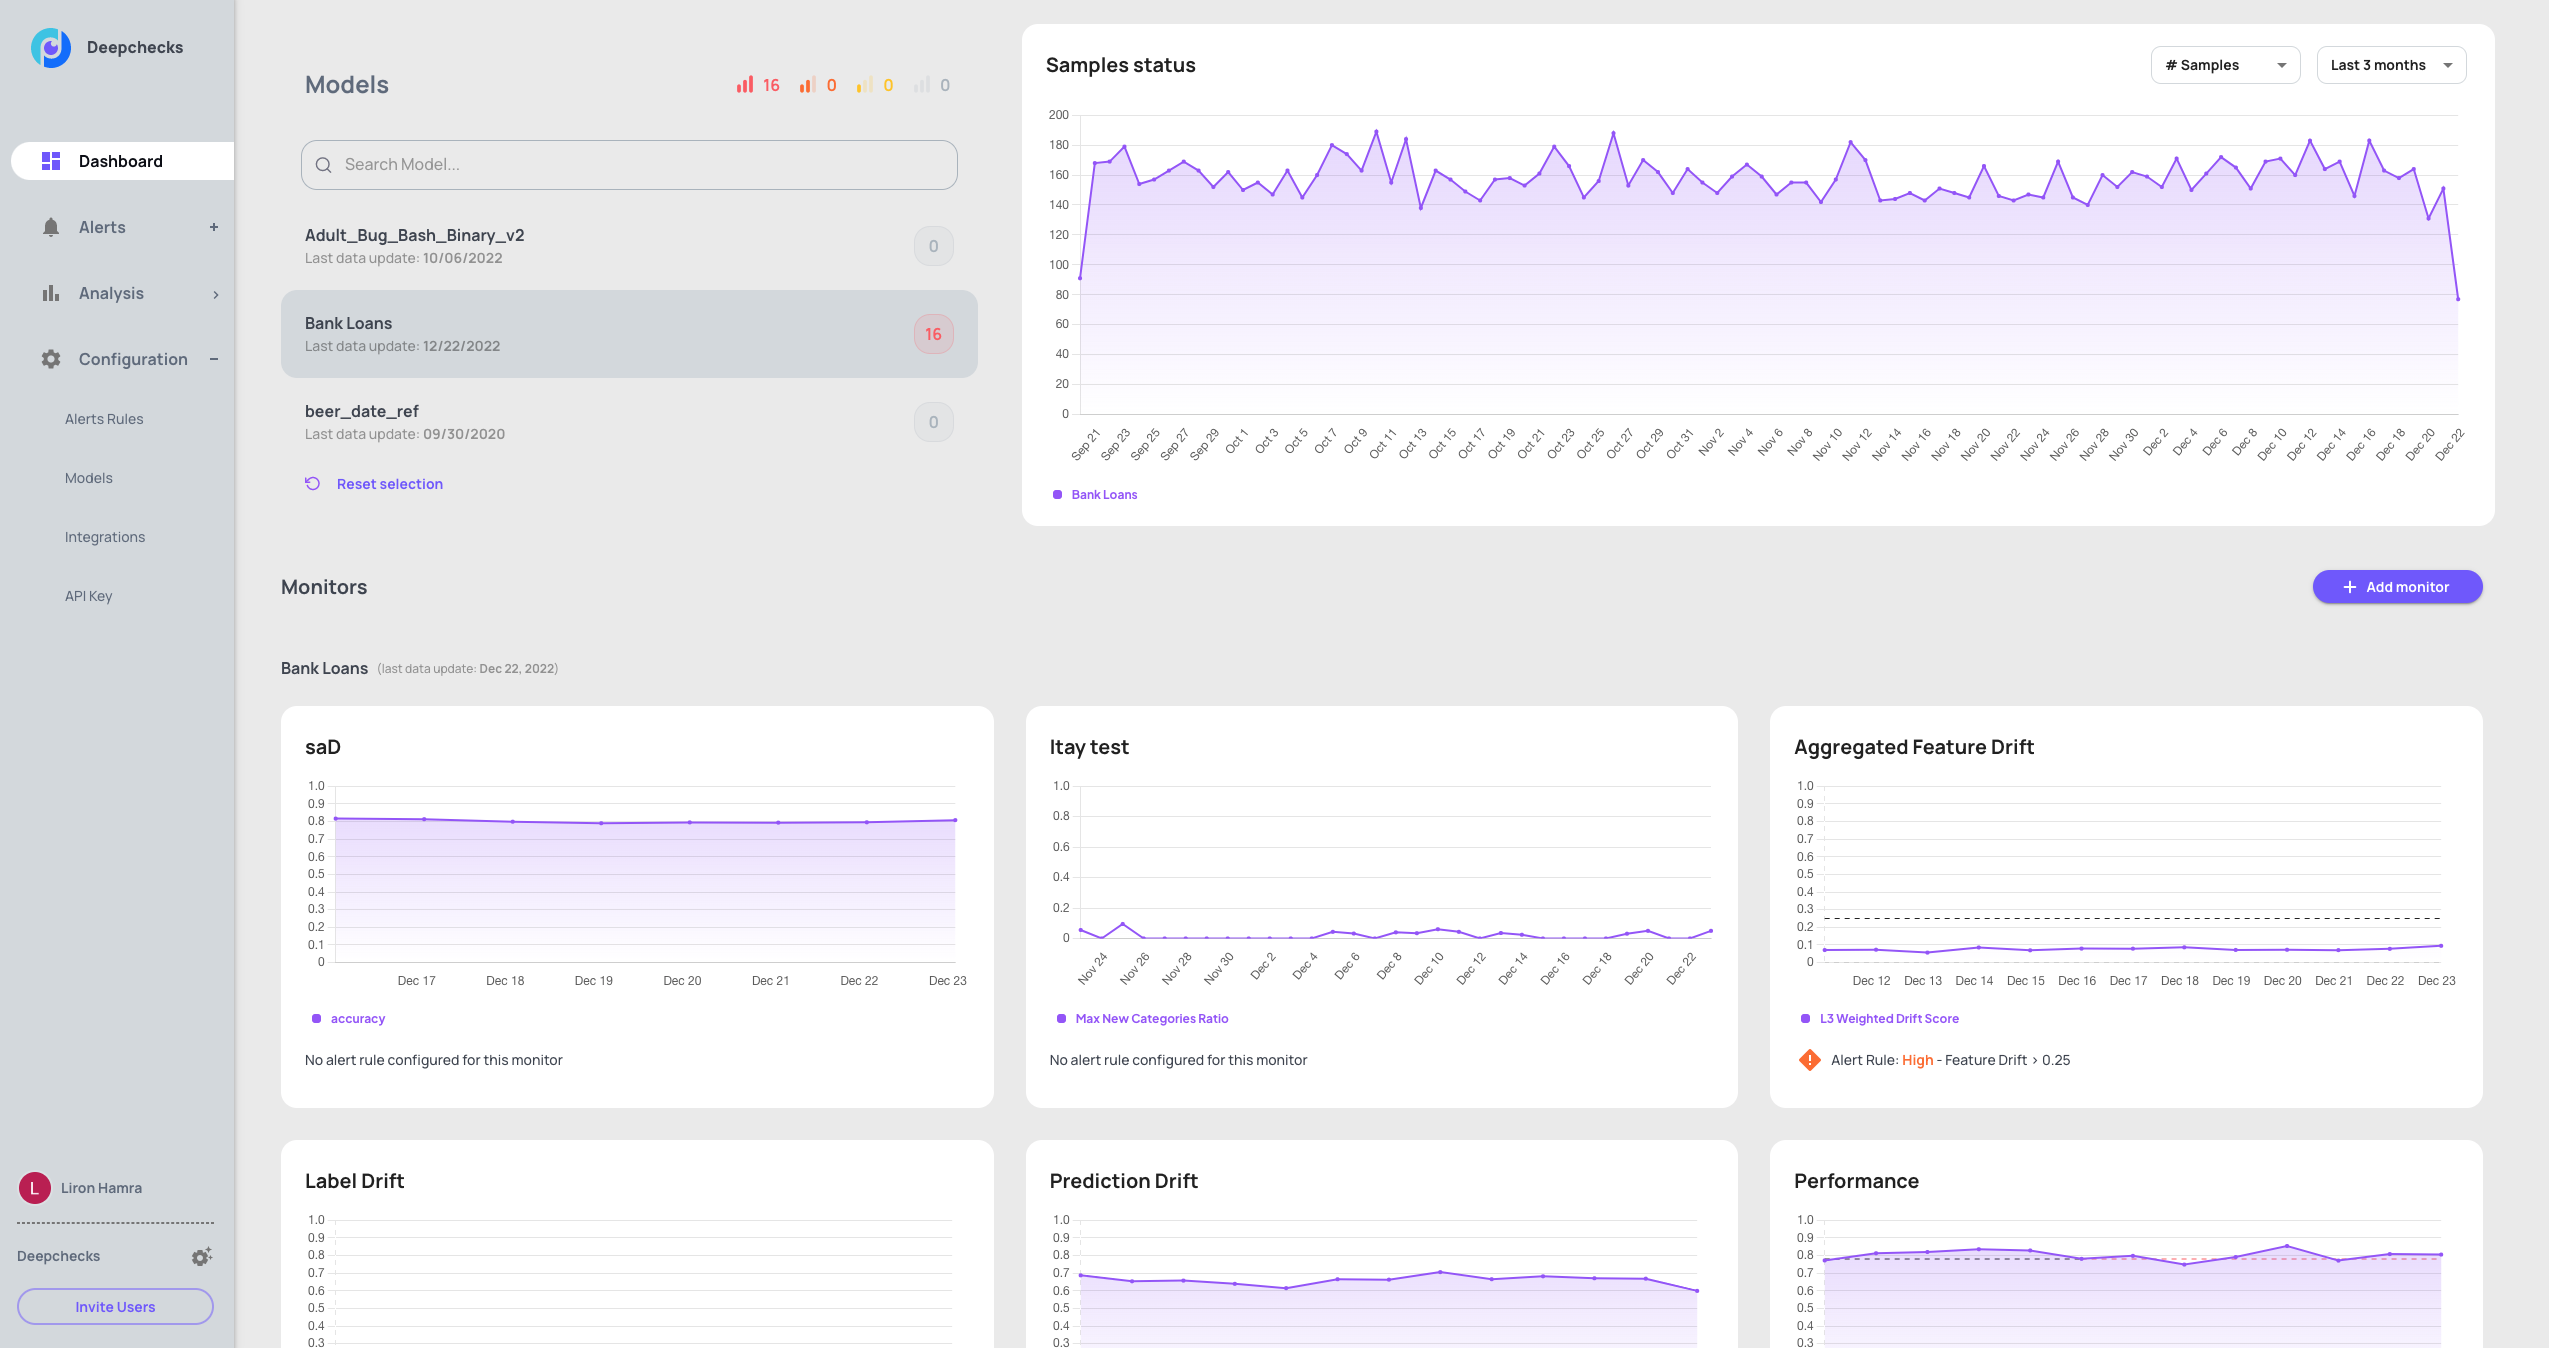
Per model view#
Selecting one of the models in the models list will filter the view to that single model.
Monitors and Alerts model menu#
Every monitor can have several alert rules which are defined relative to the monitor’s data. This gives the possibility of defining a range of alert rules, activating them according to the severity of the alert.
Defining a monitor#
A monitor is defined based on a deechecks open-source Check. Beyond selecting the check to be monitored, you can focus your attention to a specific segment of the data which might have shown unstable results in the past.
Monitor data segments#
A segment is defined as a combination of a feature or data column and values or a value range.
Create alert#
An alert rule works always as a condition on a monitor and has a severity that can be used in order to route the most important alerts to your email/Slack.